Cultural Festival Timings and Live Dealer Volume Patterns Across Regulated Markets
Wendy Krause · Sep 12, 2026
Cultural Festival Timings and Live Dealer Volume Patterns Across Regulated Markets
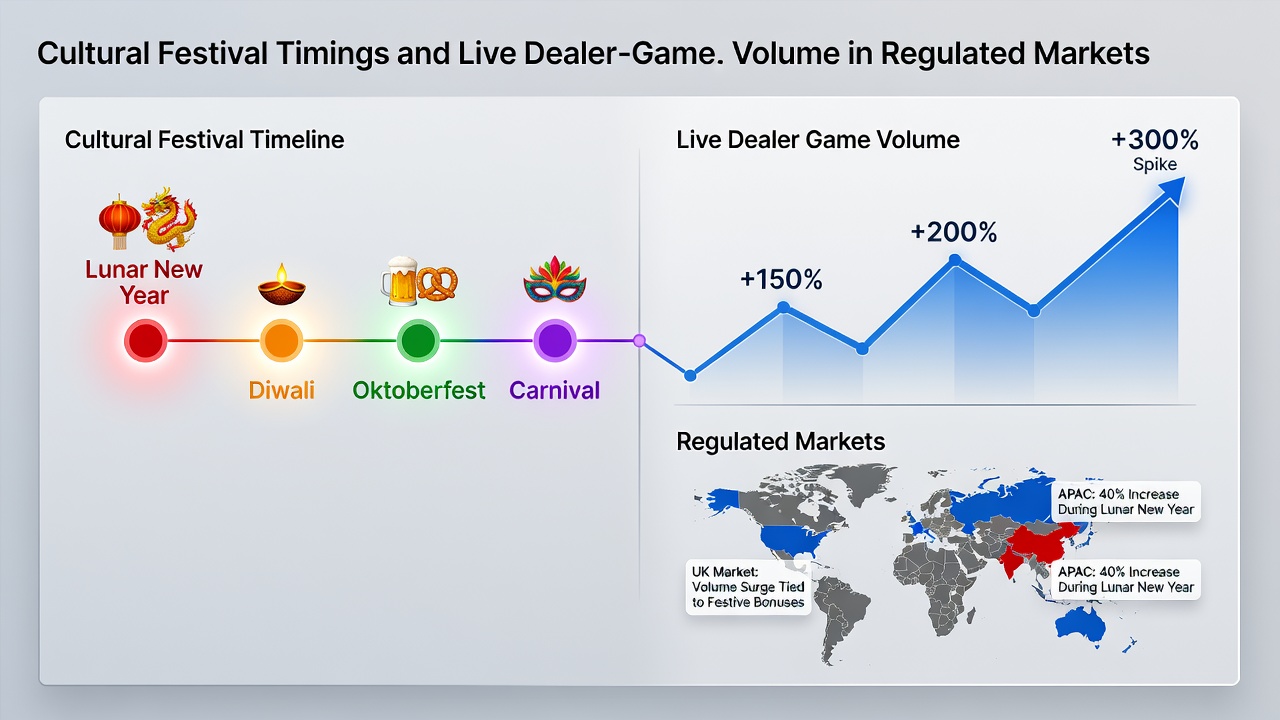
Data from multiple regulated jurisdictions shows clear correlations between major cultural festival dates and temporary increases in live dealer game participation, particularly in baccarat, roulette, and blackjack formats, and these patterns emerge consistently across different regions without uniform explanations tied to any single cause.
Festival Calendars Align with Participation Shifts
Operators in markets such as New Jersey, Ontario, and parts of Europe track session volumes against national and international holiday schedules, and figures from the first half of 2026 indicate that spikes often begin several days before the main festival dates and extend into the following week. Chinese New Year celebrations in late January and early February have coincided with elevated baccarat activity in platforms serving Asian diaspora communities, while Diwali periods in October and November show parallel rises in roulette engagement in the same jurisdictions. Observers note that these increases occur alongside broader recreational spending patterns during family gatherings and public events, although direct causation remains difficult to isolate from general seasonal trends.
Regional Data Highlights Distinct Timelines
Records maintained by iGaming Ontario reveal that live dealer tables experienced volume growth of 18 to 24 percent during the 2025 Lunar New Year window compared with the preceding month, and similar patterns appeared in Michigan and Pennsylvania data sets around the same dates. In Australia, state regulators documented comparable upticks during the Sydney Lunar Festival period, where live dealer sessions extended later into evening hours across multiple operators. European markets registered separate movements tied to Carnival celebrations in February and March, with blackjack tables showing the strongest response in southern jurisdictions. These shifts do not appear uniformly across all game types, as slots and sports betting often follow different calendars.
September 2026 Patterns and Mid-Autumn Influences
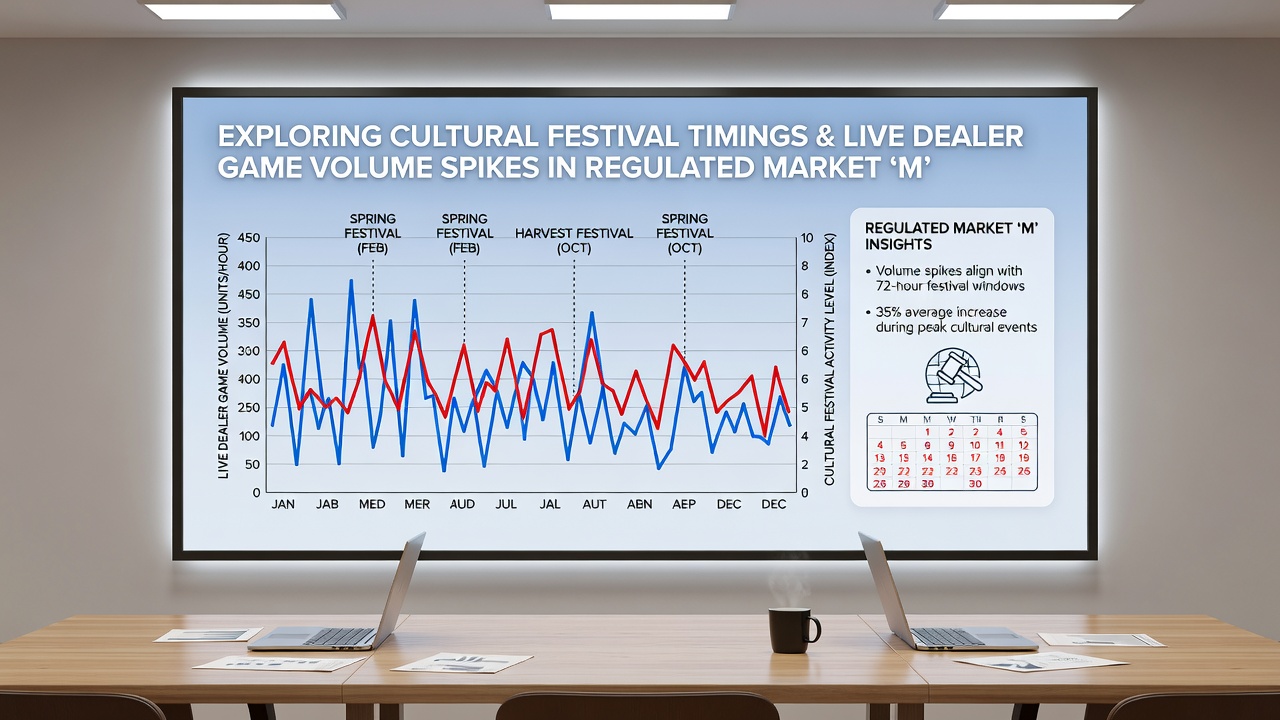
By September 2026, mid-autumn festival dates aligned with measurable increases in certain live dealer categories across North American platforms, and cross-border operators reported extended table availability during those weeks to accommodate demand. Data compiled through regulatory filings shows that participation curves rose steadily from the second week of the month onward, coinciding with harvest-related cultural events in multiple source countries. Analysts tracking these movements point to overlapping time zones as one contributing factor, since players in Asia and North America accessed the same dealer streams during overlapping evening windows.
Regulatory Reporting and Industry Tracking Methods
Regulated markets require operators to submit detailed transaction and session data on monthly or quarterly schedules, which allows researchers to overlay festival calendars against raw volume metrics. The iGaming Ontario annual reports provide one such dataset that has been used to identify timing correlations, while the New Jersey Division of Gaming Enforcement publishes comparable tables that permit similar cross-referencing. Industry groups such as the European Gaming and Betting Association have also compiled aggregated statistics from member operators, and these compilations indicate that the magnitude of spikes varies by festival type and by the cultural composition of the player base in each market. Platforms adjust staffing and game availability in advance of known festival periods based on historical patterns rather than predictive modeling alone.
Game-Specific Responses During Events
Live dealer baccarat consistently shows the largest relative increases during East Asian festival periods, whereas roulette volumes rise more noticeably around European and South Asian celebrations. Blackjack participation tends to follow a steadier baseline with smaller festival-linked deviations. These distinctions appear in operator dashboards across regulated environments and reflect player preferences documented in transaction logs rather than marketing campaigns. Extended histories from high-volume periods demonstrate that average session lengths also lengthen slightly during festival windows, though the increase remains modest compared with the growth in total sessions started.
Conclusion
Available regulatory data and operator records establish recurring links between cultural festival timings and temporary elevations in live dealer game volumes across several regulated markets, and these connections hold across multiple years and jurisdictions. Continued collection of session metrics will allow further refinement of these observed patterns without requiring assumptions about underlying player motivations.